Tuesday, December 1, 2009

Philip Morris International: Great Company but Fairly Valued, Accumulate on Pullbacks

Philip Morris International (PMI) should be monitored and considered for potential purchase in the future at more attractive valuation levels. PMI is an attractive holding based on its strong pricing power, exposure to growing emerging markets, double digit earnings growth, strong free cash flow generation and attractive dividend yield. However, the stock is currently trading in line with its international peers based on EV/EBITDA multiples and a slight premium to its international peers based on P/E multiples. On a forward PEG basis, PMI’s stock is also trading at 1.2x its next five year estimated EPS growth rate of 11%, which appears to be a fair valuation.


Investment Rationale

Emerging market growth should drive top line growth

  • PMI generated 33% of its revenue from emerging markets last year 
  • The company should continue to benefit from price increases in emerging markets
  • Management believes that cigarette prices are still very low by international standards in emerging markets and have a lot of room to increase (which is confirmed in the table below comparing prices of 20 pack of Marlboro to Big Macs)
Sources: Economist, JPM


  • Furthermore, PMI should benefit from stronger emerging market economic growth that should drive per capita income growth and cigarette volume growth 
  • PMI is also well positioned to gain market share in emerging markets based on the strong brand name of its premium Marlboro brand, which is very popular with younger smokers

Strong pricing power
  • PMI is the price leader in markets that contribute 70% of its operating income according to industry experts
  • The company should be able to raise prices in all markets, which should allow the company to generate mid single digit revenue growth

Revenue growth from acquisitions
  • Following the spin-off from Altria, management was interested in increasing its M&A activity
  • PMI acquired Rothmans, Canada’s 2nd largest tobacco producer, for $1.9 billion last year
    • This acquisition gave the company control of a third of Canada's cigarette market and the leading share of its fast-growing discount category
  • PMI acquired Swedish Match’s South African operations for approximately $220 million in July 2009
    • This acquisition gave the company control of roughly a third of South Africa’s tobacco market
  • Management will continue to explore accretive acquisitions that can expand its presence in key international markets

Beneficiary of weaker U.S. dollar
  • Since PMI generates all of its revenue outside of the U.S., its revenue growth benefits from U.S. dollar weakness
  • Many currency experts believe that the U.S. dollar will continue to depreciate relative to international currencies over the next several years based on the U.S.’s record budget deficits and higher rate of money printing

Cost cutting opportunities
  • PMI initiated a plan to cut $1.5 billion in costs from 2008 to 2010 based on moving production facilities to European plants, eliminating lower margin product lines and reducing SG&A costs by maximizing efficiency of shared services and reducing back office operations
  • These cost cuts should be partially offset by cost increases of tobacco leaf procurement and higher direct manufacturing costs that should total around $500 million

Strong free cash flow generation
  • PMI generated $6.8 billion in free cash flow in 2008
  • The company plans to continue to use its FCF to buy back shares (the company has over $3.5 billion remaining on its current share repurchase plan) and to fund its 65% dividend payout ratio
  • At the end of the third quarter of 2009, the company’s net debt / ebitda ratio was 1.2x, which is very conservative for a leading consumer staples company

China optionality
  • The Chinese tobacco market is currently predominantly controlled by China National Tobacco Corporation, the Chinese state-run monopoly
  • China’s estimated annual cigarette sales are $100 billion vs. $70 billion in the U.S.
  • PMI currently sells Marlboro cigarettes in China through a licensing agreement, but it does not control a very large percentage of the market
  • If the Chinese tobacco market opened up more over the next five years, PMI’s volume growth would benefit

Concerns and Risks

Market share losses in Europe
  • PMI lost 1%-2% market share in the EU over the last two years (bringing its total share to ~39%) due to down trading (which has been increasing with higher unemployment levels) and aggressive price competition in select markets from British American Tobacco
  • As a result of these factors, PMI will probably not raise prices as aggressively in Europe over the next several years to help stabilize its market share

Susceptible to price wars
  • PMI lost about 4% of its EBIT in 2006 due to a price war in Spain according to industry experts
  • Gallaher and Altadis were former competitors that were most aggressive in discounting prices in the EU and Eastern Europe to gain share
  • Both companies have been acquired, which should reduce the risk of a future price war
  • However, British American Tobacco remains aggressive in select markets

Tax increases
  • PMI has limited control of tobacco tax increases in international countries that can come in the form of excise taxes, sales taxes and import duties
  • Taxes can impact PMI’s price competitiveness relative to local brands and can result in down trading
  • According to management, the excise tax environment has generally become fairer and more reasonable over the last five years

Earnings Model


Valuation

Historical Valuation Analysis
  • PMI’s stock has only traded as a separate entity for under two years, which limits the usefulness of historical valuation analysis
  • On an EV/EBITDA basis and on a forward P/E basis, PMI is trading close to the middle of its historical trading ranges


Source: Capital IQ


Source: Capital IQ


Comparable Valuation Analysis
  • PMI’s stock is trading in line with its international peers based on EV / next year EBITDA multiples and a 10% premium to its international peers based on forward P/E multiples


Source: Bloomberg


Company Description

Philip Morris International was spun off from Altria in March 2008 to protect its international earnings from U.S. litigation. Cigarette related litigation is rare overseas due to a higher tolerance for smoking.

The company is one of the largest international manufacturers and sellers of cigarettes and other tobacco products. It is the market leader in Europe, Eastern Europe, Turkey, Mexico, Argentina and Indonesia.

PMI generated 45%, 35% and 20% of operating profit from the European Union, emerging markets and Asia respectively last year.

Geographic EBIT Mix in 2008


PMI’s portfolio comprises international and local brands. Its primary international brands include Marlboro, Merit, Parliament, Virginia Slims, L&M and Chesterfield. Marlboro represented 36% of PMI’s volume sales in 2008 and the Marlboro brand has helped PMI gain control of 53% share of the international premium cigarette market.

PMI purchases tobacco leaf of various grades throughout the world, primarily through independent tobacco dealers. Its largest sources of supply are the U.S., Brazil, Indonesia, Turkey, Greece and Argentina. The company also contracts directly with farmers in several countries including the U.S., Argentina, Mexico, Indonesia, Ecuador, Dominican Republic, Poland, Colombia and Portugal.

Volume and Pricing Trends


Sources: Citi Research (10/23/09), PMI, CIRA


PMI’s volume trends deteriorated in the third quarter of 2009 on the back of very challenging year-over-year comps. The company was able to increase its average prices significantly, particularly in emerging markets, to generate respectable top line growth of 4.1% in the third quarter.


Marlboro Retail Price, Tax and Net Proceeds in Select Countries


Source: Citi Research (10/23/09)


Tobacco Industry Consolidation

There has been significant consolidation in the tobacco sector in recent years, including Japan Tobacco’s acquisition of Gallaher, Imperial’s purchase of Altadis, PMI’s acquisition of Rothmans, and British American’s purchase of Tekel. The following table highlights major M&A deals in recent years. Consolidation should result in less price competition, which favors the major players.


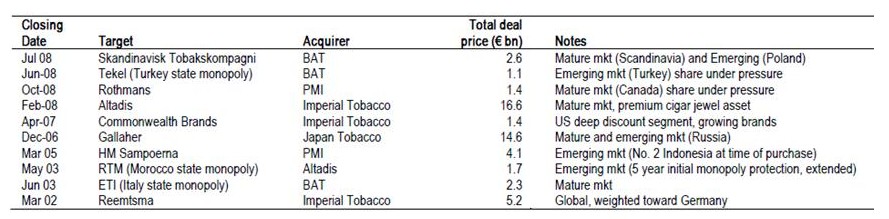
Source: JPM Research


Competition

PMI’s major international tobacco competitors include British American Tobacco, Japan Tobacco and Imperial Tobacco. PMI also competes against several regional and local tobacco companies as well as government-owned tobacco companies, principally in China, Egypt, Thailand, Taiwan, Vietnam and Algeria.

PMI controlled 16% of the international tobacco market and 26% of the international tobacco market excluding China in 2008.


Source: PMI Presentation

Saturday, September 5, 2009

Tesco: Consistent Earnings Growth at Attractive Price

Tesco (ADR stock ticker: TSCDY) should be considered for potential purchase based on its leading position in the UK retail market, its expansion opportunities in international markets, its ability to improve operating margins and its attractive dividend yield of 3.6%.

Tesco’s ADR stock price target is $21.30 based on applying a 13x multiple to its earnings next year. Tesco deserves to trade at a premium multiple to its high single digits / low teens long-term earnings growth rate based on its consistent earnings execution, its focus on maximizing shareholder value, its best in class EBIT margins and its strong return on equity.


Company Description

Tesco is the largest UK retailer and the 3rd largest global retailer. Tesco controlled 30.8% of the UK grocery market as of May 2009 and ~9% of the UK non-food retail market. The majority of its sales and profits are generated in its 2,282 UK stores, which are segmented into the following formats:

  • Tesco Express – neighborhood convenience store that focuses on fresh products, 961 stores
  • Tesco Metro – city center convenience store, 174 stores
  • Tesco Superstore – conventional supermarket, 448 stores
  • Tesco Extra – hypermarket that serves an entire community, 177 stores
  • Tesco Homeplus and One-Stop account for its remaining stores

The company also sells general merchandise through Tesco Direct, it’s online and catalog businesses.

Tesco’s management focuses on customer satisfaction by giving them more choices where to shop and by offering them attractive prices on its products. In the fourth quarter of 2008, Tesco began selling new discount range of products to compete more aggressively on price against discounters. Its prices are generally perceived to be at a small premium to Asda and a small discount to Sainsbury and Morrison.

Tesco’s UK Like-For-Like (LFL) Sales Growth Trends


Sources: Tesco, Cazenove

Tesco has built a significant international operation by entering JVs with local partners and ended its fiscal year with 1,911 stores. Non-food represented about 30% of international sales. Tesco has leading market share positions in Hungary (#1), Thailand (#1), Ireland (#2), S. Korea (#2), Malaysia (#2), Slovakia (#3), Poland (#4) and Czech Republic (#4).

The company entered China several years ago and plans to open more hypermarkets and shopping centers over the next decade. The Chinese retail market remains very fragmented and the top three players each control less than 1% market share.

In 2008, Tesco announced its plan to enter Indian market with its own cash and carry (wholesale) operation and a franchise agreement with Trent to support their Star Bazaar hypermarkets.

FY 2009 Geographic Sales Mix


Source: Tesco 2009 Annual Report


 FY 2009 Geographic Profit Contributors


Source: Morgan Stanley


In 2008, Tesco purchased Royal Bank of Scotland’s 50% stake in Tesco Personal Finance (TPF). Tesco plans to take advantage of consumers’ distrust of UK banks to increase its deposit base and financial service activity meaningfully in the next several years.

Competition

Tesco’s primary supermarket competitors in the UK include Asda (17.3% share of UK grocery market), Sainsbury (16.3% share), WM Morrison Supermarkets (11.2% share), Waitrose (3.7% share), Aldi (2.9% share) and Lidl (2.3% share). In recent years, some of its major competitors have turned around their struggling stores, which will make it more challenging for Tesco to gain significant share in the UK market going forward.

Asda’s management improved its stores’ product offering (organic and premium foods as well as non-food offerings) in 2005, which has helped the company’s LFL growth to increase. In the past two years in a more challenging UK consumer spending environment, its discount prices have also helped the company to gain market share. The German discounters Aldi and Lidl have also benefited from the tougher market in recent years.

Morrison took several years to digest the acquisition of Safeway stores in 2004 and offer the right products in its stores. In September 2006, Marc Bolland took over as CEO and improved stores’ product offerings and promotion-based marketing efforts. Since late 2007, its LFL sales growth rates have led the industry.


LFL Sales Growth Trends of Major UK Food Retailers


Sources: Companies, Deutsche Bank

Tesco also competes against multiple local companies in the international markets in which it operates as well as major global players such as Carrefour, Wal-Mart and Ahold.

Earnings Model


Income Statement Summary

Tesco’s UK LFL sales grew 4.3% last year (3% ex gasoline) and its net new stores contributed 2.7% to growth. Its UK sales also benefited from a 53rd week that represented 2.1% of sales and the first time contribution from the consolidation of Tesco Personal Finance. International sales grew 30.6% (including FX benefits) and 13.6% at constant exchange rates benefiting from square footage growth and strong sales growth in Asia.

The company’s operating margin was flat at 5.9% in fiscal 2009 as unfavorable sales mix was offset by increased productivity and good expense control. Its EPS growth was only 2.6% last year, hurt by 26.7% tax rate vs. 24% in fiscal 2008 when it benefited from tax reimbursement and lower UK corporate tax rate.

Balance Sheet Summary

Tesco has an impressive property portfolio that the company’s management and industry experts value at approximately £30 billion (that represents ~75% of company’s enterprise value). The company ended the year with £9.6 billion in net debt, £3.4 billion more than in the prior year, due to acquisition of Homever in S. Korea, purchase of stake in Tesco Personal Finance and unfavorable currency movements. Tesco plans to reduce its net debt by £1 billion this year through lower capital spending, property sales and improvement in working capital. The company has £300 million in bond maturities this fiscal year.

Cash Flow Statement Summary

Tesco generated £5 billion in operating cash flow last year, benefiting from improvement in working capital efficiency and good inventory management. Its capital expenditures were £4.7 billion last year (£2.6 billion in UK and £2.1 billion in international). The company expects its capital expenditures to decline to £3.5 billion this year through spending less on mixed use development land and purchasing fewer existing stores from UK competitors.

Investment Rationale


UK retail market leader

  • Its leading position allows it to receive attractive pricing from its suppliers and benefit from economies of scale in distribution and marketing
  • Tesco’s UK business should continue to grow in the mid-single digits (~50/50 contribution from LFL growth and net new space growth) over the next decade and its cash flow from this business should support its international expansion

Strong international growth
  • Tesco has established leading retail market positions in S. Korea, Thailand, Malaysia and Hungary
  • In 2008, the company acquired 36 Homever hypermarkets in S. Korea, which increased its presence significantly in Seoul, where ~50% of S. Korea’s population lives
  • Tesco converted the acquired stores into Homeplus stores and saw average sales uplifts of 50%
  • During fiscal 2009, Tesco added 63% to its square footage in S. Korea, including the converted Homever stores
  • Tesco currently has 110 stores in S. Korea and plans to add 5 this year and 10-15 in subsequent years
  • Tesco controls about 9% market share in Thailand and should continue to gain share at the expense of the independent market that controls 76% share
  • The company plans to increase its square footage 8% this year in Thailand
  • In total, Tesco plans to grow its square footage 10% in international markets this year and LFL growth should improve to low single digits in global economic recovery

Tesco Personal Finance growth opportunity
  • TPF generated 65% of its profit from insurance and 35% from banking products, credit cards and fees from its ATM network last year
  • The company grew its deposit book to over £4.5 billion from £2.5 billion in the last four months of its fiscal year, benefiting from its trusted brand name and consumers’ distrust of major UK banks
  • Tesco aims to double profits over the next five years from TPF (from £244 million last year) by leveraging its store network and customer base and by opening up new full service branches

Operating margin expansion
  • Tesco’s operating margin should increase 20 bps this year benefiting from:
  • 200 new Express store openings, bringing total store count to 1,161; Tesco benefits from ~4%-5% higher gross margins on its Express stores due to lower operating costs
  • Increase in international sourcing of non-food products
  • Additional distribution cost savings estimated at £100 million this year

Property sales
  • Tesco plans to continue selling portions of its £30 billion property portfolio over the next several years

Fresh and Easy expansion opportunity
  • Tesco entered the U.S. market with its Fresh and Easy stores on the West coast in 2008
  • These convenience stores offer organic, ready-to-eat food and low prices
  • Tesco ended the fiscal year with 115 stores and plans to open 60-70 new stores this year
  • Last year, these stores generated losses of £142 million and management expects similar losses in the upcoming year
  • However, longer-term, the U.S. has the potential to be an important market for the company and could increase U.S. interest in its stock if the Fresh and Easy stores become popular

Concerns and Risks

Market share losses in UK market

  • Tesco lost market share for the first time in several decades in 2008 hurt by turnarounds at competitors and consumers’ migration to discounters
  • It will be difficult for Tesco to gain significant share going forward, but it should be able to maintain its 30+% leadership position


Sources: TNS, Morgan Stanley


Sizable debt load
  • Tesco ended the year with £9.6 billion in net debt, up £3.4 billion from the prior year
  • About 40% of the company’s debt is denominated in Euros and US$ so Tesco was hurt by the depreciating GBP in 2008
  • Nevertheless, its interest coverage ratio was 8.9x last year and does not appear too aggressive

Exposure to weaker European economies
  • Tesco is exposed to weaker economic growth in Ireland, Slovakia and the Czech Republic
  • Management said that it has recovered in Hungary (which entered recession in 2006) by continuing to expand its store base and by offering attractive pricing. Tesco plans to follow the same game plan in other European countries that are currently struggling.

ADR shareholders exposed to potential GBP depreciation
  • The British Pound depreciated from 2.0 USD/GBP in summer of 2008 to roughly 1.4 USD/GBP in first quarter of 2009 on weaker housing and financial markets and higher deficits
  • In recent months, the Pound has recovered to 1.6 USD/GBP as housing market has stabilized, but any deterioration in economic outlook for UK would have negative impact on the currency as well

Valuation

Historical Valuation Analysis

  • Tesco is trading at attractive P/E and EV/EBITDA valuation levels compared with its historical valuation levels
  • However, since its growth rate in its core UK market will not be as high as in the past, it might not be appropriate to use peak historical valuation levels to determine fair value
  • Tesco needs to demonstrate success in one of its big new markets, such as China, India or the U.S. to revive its sales growth to the double digits and earn a valuation multiple close to its historical peak level
Tesco’s P/E Ratio 1999 - present


Sources: FactSet, Cazenove


Tesco’s EV/EBITDA Ratio 1999 – present


Sources: FactSet, Cazenove


Comparable Valuation Analysis
  • Tesco is trading at a 16% discount to its peers based on current year P/E multiples despite its stronger sales growth, EBIT margins and ROE
  • Tesco is trading at a premium to its peers based on EV/EBITDA and EV/Sales. This can partly be explained because Tesco operates in many international markets where the tax rates are lower than in the UK and Europe so this benefits its earnings, but not its EBITDA or sales.


Source: Bloomberg (09/01/09)


Price Target

Tesco’s ADR stock price target is $21.30 based on applying a 13x multiple to its earnings next year. Tesco deserves to trade at a premium multiple to its high single digits / low teens long-term earnings growth rate based on its consistent earnings execution, its focus on maximizing shareholder value, its best in class EBIT margins and its strong return on equity. Tesco needs to demonstrate success in one of its big new markets, such as China, India or the U.S. to revive its sales growth to the double digits and to earn a higher valuation multiple.


Full Disclosure

Recommended to Bolter and Company, a NY-based investment management firm, on September 2, 2009
No current positions in family accounts

Friday, August 14, 2009

Hansen Poised to Benefit from New Products and International Expansion

Hansen Natural Corporation ("HANS") should be considered for potential purchase based on its #2 position in fast growing global energy drinks market, its ability to gain market share in the U.S. through introduction of innovative new products, its opportunity to expand in international markets, its cash-rich balance sheet and its strong cash flow generation.

Hansen’s stock price target is $39 based on applying a 15x multiple to its earnings over the next year and adding its net cash per share of $3.46. A 15x target multiple appears appropriate based on its ability to grow its sales and earnings in the low to mid teens over the next several years.

The stock should be accumulated in stages (25% or 33% of planned total position size purchased initially) given its volatility and potential overreactions associated with its short-term sales results in current challenging economic environment.


Company Description

Hansen Natural Corporation develops and markets energy drinks, natural sodas and juices and is headquartered in Corona, California. Hansen has two reportable segments: Direct Store Delivery (DSD), whose principal products are energy drinks, and Warehouse, whose primary products include natural sodas and juices. The DSD segment utilizes distributor networks and the Warehouse segment sells directly to retailers. The distribution of its energy drinks in the U.S. and Canada are almost equally divided between Anheuser Busch distributors (to on premise retailers, including bars and nightclubs) and Coca-Cola bottlers (to traditional food and beverage retailers).

The company is the #2 player (28% market share) in the $6.5 billion U.S. energy drinks retail market. Its energy brands include Monster Energy, Monster Khaos, Monster Assault, Monster M-80, Monster Heavy Metal, Monster MIXXD, Lost Energy and Joker Mad Energy. Approximately 90% of Hansen’s sales and 95% of its operating profit is generated from its energy drink products.

Hansen outsources the manufacturing and packaging of its products to third party bottlers and contract packers. The company purchases concentrates, juices, flavors and packaging materials and delivers them to its bottlers and contract packers. One of the benefits of outsourcing is that the company can introduce new products quickly at a fairly low cost since it does not have to build manufacturing capacity and bring on more workers. Hansen has a small labor force of about 900 employees, 700 of which are in sales and marketing.

Hansen markets its Monster Energy drinks to target demographic of 18 to 30 year old males who are into action sports and rock music. The company does not use mass media marketing, such as television ads or billboards. Instead, Hansen focuses on sponsoring athletes, artists, tours and events to target its young male demographic. Hansen recently signed Valentino Rossi, the world champion MotoGP racer, to a sponsorship deal, which should help the company gain market awareness in Europe and Australia.

Its customers include Coca-Cola Enterprises, Wal-Mart (11% of sales), AB Distributors, Kalil Bottling Group, Trader Joe’s, John Lenore & Company, Costco, The Kroger Co., Safeway and Albertsons.

2008 Customer Mix


Source: Hansen 2008 10K

Competition

Hansen’s competitors in the energy drink segment include Red Bull GmBH, Pepsi (Amp, SoBe No Fear, SoBe Adrenaline Rush), Rockstar, Coca-Cola (Full Throttle, NOS) and Anheuser Busch (180). Rockstar is distributed by Coca-Cola and Pepsi has decided to focus its resources on Amp, at the expense of its SoBe energy products.

Its competitors in the natural soda category include Coca-Cola, Pepsi, Cadbury Schweppes, Jones Soda, Clearly Canadian Beverage Company and Crystal Geyser. Hansen’s competitors in the juice segment include Tropicana, Tree Top, Mott’s, Martinelli’s, Welch’s, Ocean Spray, Minute Maid, Langers, Apple and Eve and Juicy Juice. Its competitors in the coffee beverage market include Starbucks, Rockstar Roasted, Caribou Coffee and Godiva.


Industry Overview

U.S. retail sales of energy drinks have more than tripled since 2003 to $6.5 billion in 2008 according to Beverage Digest.

Monster's U.S. market share in the energy drink category increased by 0.8% to 28.4% while Red Bull’s market share dropped 0.2% to 35% for the 13 weeks through June 27, 2009 according to Nielsen Reports. Rockstar's market share decreased 0.8% to 10.7%, Amp's market share decreased 0.6% to 7.3%, Full Throttle's market share decreased 0.5% to 4.3% and NOS's market share increased 1% to 3.6%.

Monster is the #2 leading energy drinks product trailing only Red Bull in the majority of international markets in which it participates.

Sports drinks, such as Gatorade and Powerade, nearly doubled sales volume during four year period from 1992-1995. The category continued to grow at 9% rate over subsequent 13 years, significantly faster than 2%-3% growth in overall non-alcoholic beverage category. Some industry experts expect energy drinks to follow similar course and predict that energy drinks will resume mid-to-high single digit growth following recovery in U.S. economy.


Earnings Model


Financial Results

Sales Growth

In 2007, net sales grew 49.3% benefiting from volume sales growth of 35.3% and price per case increases of 10.3%

  • Net sales growth was driven by Monster Energy, Java Monster (coffee drinks) and new energy products including M-80, MIXXD and Heavy Metal
In 2008, net sales grew 14.3% benefiting from volume sales growth of 4.3% and price per case increases of 9.6%
  • Net sales growth was driven by Monster Energy, Java Monster and new energy products, including Shooter, MIXXD and Heavy Metal
In 2009, I expect sales to grow 10%, in line with growth in the first half of 2009
  • Net sales growth should be driven by Monster Energy, Java Monster, Monster Expresso and Monster shot products in the U.S. as well as growth in international markets
Margins and Profitability

In 2007, gross margin decreased to 51.7% from 52.3% in the prior year due to sales mix (increased sales of certain energy drink packages with lower gross margins) and to higher raw material costs. Operating margin also decreased to 25.5% in 2007 compared with 26.2% in 2006 owing to lower gross margin and slightly higher operating expenses (warehousing, marketing and payroll) as percentage of sales.

In 2008, gross margin increased to 52.1% from 51.7% in the prior year due to accelerated revenue recognition associated with termination of certain distributors during fourth quarter and sales mix benefits, both of which were only partially offset by higher raw material costs. Operating margin decreased to 15.8% in 2008 compared with 25.5% in 2007 due largely to costs associated with terminating existing distributors. Excluding these costs, operating margin would have increased to 27.2% in 2008.


In 2009, I expect gross margin to increase to 52.5% from 52.1% in the prior year benefiting from lower raw material prices. I expect operating margin to increase to 29.4% benefiting from gross margin improvement and lower operating expenses as a percentage of sales.

Investment Rationale

Gaining market share in U.S. energy drink market

  • Hansen’s market share increased to 28% in the second quarter of 2009 according to Nielsen Reports from 19% in 2005 according to Beverage Digest
  • The company has been able to gain share over Red Bull due to its strong new product introductions, unique marketing strategy and its distribution agreements with leading players, such as Coca-Cola and Anheuser Busch
  • Hansen should continue to gain share in the second half of 2009 due to introduction of Monster Expresso, Monster Import and Nitrous products


Source: UBS

Good growth in energy drink market
  • The energy drink market should continue to grow more rapidly than the overall non-alcoholic beverage market over the next several years following the growth path of similar innovative product lines in the past, such as sports drinks
  • Although growth in the blue collar segment (truck drivers and construction workers) has decreased in the past year due to the economic downturn, demand should reaccelerate with economic recovery since Monster products provide energy that traditional drinks do not

International expansion
  • Hansen announced a distribution agreement in Europe with Coca Cola Company and Coca-Cola Enterprises in October 2008
  • The agreement covers France, the United Kingdom, the Netherlands, Belgium, Luxembourg and Monaco
  • Initial results have been extremely positive in all regions except for the UK where alternative energy products are already well established
  • The company also has distribution agreements in Spain, Italy and New Zealand with smaller distributors
  • Hansen recently entered a distribution agreement with Comercializadora Eloro, a subsidiary of Grupo Jumex, for exclusive distribution of its energy drinks throughout Mexico
  • Jumex is the largest juice producer and distributor throughout Mexico
  • Monster is currently the #2 player in Mexican energy drink market
  • The company also recently signed new distribution agreements in Australia and Brazil and expects to start selling in these markets in the second half of 2009
  • The international energy drink market is estimated to be approximately $5 billion in size, so Hansen’s presence in this market nearly doubles its addressable market
  • During 2008 and the first half of 2009, international sales accounted for 8% and 12% of its respective sales

Opportunity to gain share in higher-margin, faster-growth energy shots market
  • The energy shots market is approximately a $500 million market according to Beverage Digest
  • Hansen entered the market in September 2008 with its Hitman Energy Shooter product and introduced Monster Sniper and Monster LoBo shooters in the first quarter of 2009
  • The company should continue to gain share in this category in upcoming quarters

Strong balance sheet
  • Hansen does not currently have any debt and has $313 million in net cash
  • The company’s stock price could appreciate $5 to $10 per share if Hansen decides to take on debt depending on the amount of debt it takes on and the number of shares it repurchases

Potential acquisition target
  • Coca-Cola and PepsiCo have already looked closely at acquiring the company and Dr. Pepper Snapple’s CEO recently commented that the company has been for sale for a while

Concerns and Risks

Declining sales growth

  • Hansen’s net sales have grown in the single digits in two of the last three quarters owing to deteriorating U.S. economy and weaker economy in California that contributes roughly 20% of sales
  • I expect sales growth to improve in 2010 as the economy recovers


Increased competition
  • The alternative beverage segment, which includes energy drinks, is the fastest growing category of the beverage industry
  • Strong growth rates have attracted attention and introduction of copycat products by major beverage players
  • Fortunately, the two biggest players in energy drinks, Red Bull and Monster, are not discounting and want to maintain premium pricing
  • Hansen’s CEO said “Red Bull has done a very good job of keeping its pricing premium and keeping the category premium. We don’t believe Red Bull will resort to discounting and we don’t think we will” at a shareholder meeting in June 2009

Volatile stock price sensitive to short term sales results
  • In the last 2 weeks of May 2009, Hansen’s sales were disappointing due to slower than anticipated sales growth in international markets and challenges associated with new distribution system in U.S. (shifted some distribution to select Coca-Cola bottlers and new Anheuser Busch distributors)
  • Its stock fell 11% as a result and might be prone to similar overreactions in the future

Higher commodity prices
  • It gross margin might be hurt by higher aluminum, apple juice, milk and sugar prices as global economic growth improves
  • Packaging costs account for about 70% of total costs of goods sold and aluminum is primary packaging component

Valuation

Comparable Valuation Analysis

  • Hansen is trading at a 17% discount to its peers based on 2009 EV/EBITDA multiples and an 8% discount to its peers based on 2009 P/E multiples despite its stronger estimated sales growth and similar profitability ratios


Source: Bloomberg


M&A Valuation Analysis
  • Recent beverage acquisitions include Tropicana (acquired at 12.4x EV / trailing EBITDA multiple), Snapple (13.1x EV / trailing EBITDA multiple) and Glaceau, manufacturer of Vitamin Water (30x EV / trailing EBITDA multiple)
  • Cascadia Capital conducted a survey on beverage M&A activity between 2006 and 2008 and determined that the mean EV / trailing EBITDA multiple was 11.8x
  • Hansen’s current EV / trailing twelve months EBITDA is 10.6x
  • The following table shows the potential upside to Hansen’s stock price associated with different EV / trailing EBITDA acquisition multiples


Price Target

Hansen’s stock price target is $39 based on applying a 15x multiple to its earnings over the next year and adding its net cash per share of $3.46. A 15x target multiple appears appropriate based on its ability to grow its sales and earnings in the low to mid teens over the next several years.


The $39 price target would also equate to a 12.4x EV / trailing EBITDA multiple, which appears to be a fair acquisition multiple for Hansen based on past deals.


The stock should be accumulated in stages (25% or 33% of planned total position size purchased initially) given its volatility and potential overreactions associated with its short-term sales results in current challenging economic environment.


Full Disclosure


Recommended to Bolter and Company, a NY-based investment management firm, on August 12, 2009
No current positions in family accounts